Average grocery bill for a family of 4, benchmarked by age
The average grocery bill for a family of 4 is easiest to benchmark with USDA's food plans, which put the monthly cost for a couple with kids ages 6–8 and 9–11 at $1,024 to $1,682 in September 2026.

In this guide
The average grocery bill for a family of 4 is easiest to benchmark with USDA's food plans, which put the monthly cost for a couple with kids ages 6–8 and 9–11 at $1,024 to $1,682 in September 2026.
Where your own household lands depends on two things: which of the four plans you compare against, and which age rows match your kids. A couple with kids ages 2–3 and 4–5 is about $180–$245 lower per month on the same plan, by our sums of USDA's per-person rows. Every figure assumes food prepared at home. The plans provide a benchmark for comparing your own grocery receipts.
What the USDA Cost of Food report measures
The report prices four food plans each month (Thrifty, Low-Cost, Moderate-Cost, and Liberal) at successively higher cost levels. USDA posts them on its "USDA Food Plans: Monthly Cost of Food Reports" page, which was updated October 19, 2026, with figures for September 2026.
Each plan is the cost of a set basket of food, priced separately by age and sex. USDA says the plans assume all meals and snacks are prepared at home. Restaurant meals and takeout sit outside the figures. So do the nonfood items that often land on the same grocery receipt, such as paper towels, dish soap, and diapers.
The reference family comes from federal law. Under 7 U.S.C. § 2012(u), the Thrifty Food Plan is defined for a family of four: a man and a woman ages 20 through 50, a child ages 6 through 8, and a child ages 9 through 11. That is the family USDA prices as a single total in its Thrifty table, and it is the family behind the $1,024 figure.
The Thrifty plan also has a role outside the grocery aisle. As of October 2026, federal law makes the cost of the Thrifty Food Plan the basis for uniform SNAP allotments. A household's actual SNAP benefit also depends on income and other program rules, so the food-plan table can't tell you what a particular family would receive. SNAP eligibility and administration can vary; check your state or territorial SNAP agency for how eligibility works where you live.
Current law also sets a date for the next change to the Thrifty plan itself. USDA may not reevaluate the Thrifty market baskets before October 1, 2027, and a reevaluation may not increase the plan's cost.

The four plan figures for September 2026
For the school-age reference family, the September 2026 figures run from $1,024.00 a month on the Thrifty plan to $1,681.80 on the Liberal plan. On a weekly basis, the Thrifty plan comes to $236.30.
USDA prints the Thrifty total for this family directly. For the other three plans, the totals below are our sums of USDA's four individual monthly rows: one adult woman and one adult man ages 20–50, plus the two children. The younger-family column uses the same method with the rows for kids ages 2–3 and 4–5. USDA does not publish that younger family as a separate total, and we left its Thrifty cell blank rather than estimate it.
| Plan (September 2026) | Couple + kids 2–3 and 4–5, monthly | Couple + kids 6–8 and 9–11, monthly |
|---|---|---|
| Thrifty | Not totaled here | $1,024.00 (USDA total) |
| Low-Cost | $946.50 | $1,126.90 |
| Moderate-Cost | $1,163.50 | $1,389.20 |
| Liberal | $1,436.80 | $1,681.80 |
These are figures for the contiguous United States. USDA lists separate Thrifty totals for Alaska and Hawaii, and the gap is large. For September 2026, the same reference family came to $1,296.90 a month in Anchorage and $1,573.60 in Hawaii, compared with $1,024.00 in the main table.
USDA publishes monthly Cost of Food reports, so a figure quoted without a report month may be a year or more old. When you see "$1,000 a month for a family of four" in a headline, look for the month before comparing it with your own number.
Food is one line in USDA's larger estimate of what it costs to raise a child from birth through age 17, which a separate guide breaks down by age.

How kids' ages move the number
Older kids cost more on all three plans with comparable totals in the table. In September 2026, the school-age family's total ran $180.40 a month higher than the younger family's on the Low-Cost plan, $225.70 higher on Moderate-Cost, and $245.00 higher on Liberal.
The adults are the same in both families, so the whole gap comes from the children's rows. Here are the individual monthly rows USDA published for September 2026.
| Person (September 2026) | Low-Cost | Moderate-Cost | Liberal |
|---|---|---|---|
| Child, 2–3 | $173.50 | $207.20 | $252.10 |
| Child, 4–5 | $179.00 | $221.50 | $268.30 |
| Child, 6–8 | $261.50 | $304.70 | $357.20 |
| Child, 9–11 | $271.40 | $349.70 | $408.20 |
| Adult female, 20–50 | $276.30 | $336.40 | $429.60 |
| Adult male, 20–50 | $317.70 | $398.40 | $486.80 |
The largest increase occurs between ages 4–5 and 6–8. On the Low-Cost plan, the 6–8 row is $82.50 a month higher than the 4–5 row, while the step from 2–3 to 4–5 is only $5.50. By ages 9–11, a child's Moderate-Cost row ($349.70) is already above the adult female row on the same plan ($336.40).
For a family planning ahead, the table also shows when the bill is likely to move. A family whose younger child turns 6 this year would shift from the 4–5 row to the 6–8 row, which adds $82.50 a month on Low-Cost and $83.20 on Moderate-Cost at September 2026 prices. If your kids are older than 11, neither reference family matches. The total has to be built from the rows for their ages on USDA's current table, using the method in the next section.
How to build your own household's row
Add one monthly row for each person in your household from the same plan, then apply USDA's household-size adjustment to the sum. USDA says its individual figures assume a four-person household, so a family of four uses the sum as it is.
| Household size | USDA adjustment to the summed rows |
|---|---|
| 1 person | Add 20% |
| 2 people | Add 10% |
| 3 people | Add 5% |
| 4 people | No adjustment |
| 5 or 6 people | Subtract 5% |
| 7 or more people | Subtract 10% |
Take a household of three as an example: one adult woman ages 20–50 with kids ages 4–5 and 9–11, on the Low-Cost plan. The rows add up to $276.30 + $179.00 + $271.40 = $726.70. A three-person household adds 5%, which brings the September 2026 benchmark to about $763 a month.
A larger household works the same way in the other direction. A couple ages 20–50 with kids ages 2–3, 6–8, and 9–11, on the Moderate-Cost plan, sums to $1,596.40. Five people subtract 5%, for about $1,517 a month.
Sum the rows first and adjust once at the end, instead of adjusting each person. And these household-size factors belong to USDA's consumer food-plan figures. SNAP uses different ratios to set allotments for different household sizes, so the result says nothing about a SNAP benefit.
How grocery prices moved over the past year
As of September 2026, the BLS food-at-home price index was 1.8% higher than a year earlier. On a seasonally adjusted basis, it slipped 0.1% from August to September.
The index tracks grocery prices across the economy. It is a different measure from the cost of a USDA plan, and we were not able to match USDA's September 2025 plan rows for this article, so it does not give a year-over-year change for the four plans. Treat older USDA figures quoted elsewhere as data for their stated month.
For a rough sense of scale, a monthly grocery bill of $1,100 that moved exactly with the index would be about $20 higher than a year earlier. That is simple arithmetic on the 1.8% figure, and a single household's basket can move faster or slower than the national index.
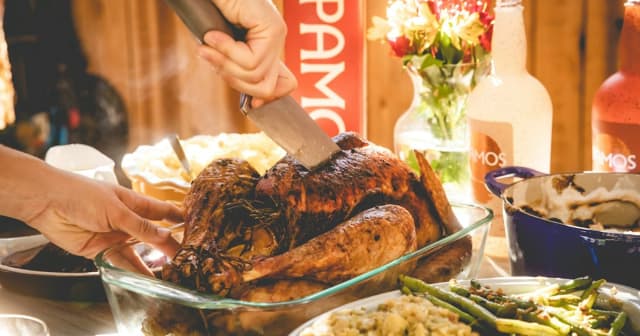
If a holiday meal is on your November list, a separate guide looks at the American Farm Bureau Federation's survey of what a Thanksgiving dinner for 10 costs.
What families actually spend compared with the plans
The plans price a basket, while the BLS Consumer Expenditure Survey records what households actually spent. In 2024, the average U.S. consumer unit spent $6,224 on food at home (about $519 a month) out of $78,535 in total spending. BLS defines that line as spending at grocery stores and similar venues, and it rose 2.8% in 2024.
A consumer unit is not necessarily a family of four. The BLS average covers households of every size and makeup, so it sits well below the four-person plan totals and can't be compared one-to-one with a reference family. The two sources answer different questions: USDA asks what a set basket costs, and BLS asks what households spent.
USDA's tables don't set a spending level for any family, and the four plans represent successively higher cost levels. They give a dated range to compare with your own receipts. If a household's grocery receipts run well above the Liberal row for its ages, the receipts may include things the plans leave out, such as restaurant meals, takeout, or the paper goods and cleaning supplies picked up in the same trip.
If the kids are old enough to weigh in on the weekly grocery list, a short family meeting is one place to bring the numbers to the table.

Before the next shopping trip, pull last month's grocery receipts, set aside the nonfood items, and put the food-only total next to the row for your kids' ages.
Frequently asked questions
How much does a family of 4 spend on groceries a month?
What is the USDA Thrifty Food Plan?
What is a reasonable grocery budget for a family of 4?
Do the USDA food plans include eating out?
Sources
All sources checked on October 28, 2026.
- USDA Food Plans: Monthly Cost of Food Reports, September 2026 tables (USDA Food and Nutrition Administration, updated October 19, 2026) https://fns-prod.azureedge.us/research/cnpp/usda-food-plans/cost-food-monthly-reports
- 7 U.S.C. § 2012(u), Food and Nutrition Act definition of the Thrifty Food Plan (U.S. Code, current through Public Law 119-118, October 7, 2026) https://uscode.house.gov/us/usc/119-118/t7/s2012/
- Consumer Price Index news release, September 2026, Table A (Bureau of Labor Statistics, October 14, 2026) https://www.bls.gov/news.release/CPI.htm
- Consumer expenditures in 2024 (Bureau of Labor Statistics, December 19, 2025) https://www.bls.gov/opub/reports/consumer-expenditures/2024/home.htm


